 Download PDF
 Request Customisation

Security Solutions Market Size, Share & Trends
Report Code
SE 3405
Published in
Oct, 2025, By MarketsandMarkets™
Security Solutions Market Size, Share & Trends by System (Fire Protection, Video Surveillance, Multi-technology Reader, Biometric Reader, Electronic Lock, Entrance Control, Intruder Alarm, Thermal Imaging), Service (Remote Monitoring, VSaaS, ACaaS) - Global Forecast to 2030

USD 523.98
MARKET SIZE, 2030

CAGR 7.2%
(2025-2030)

260
REPORT PAGES

190
MARKET TABLES
SECURITY SOLUTIONS MARKET SIZE, SHARE & TRENDS
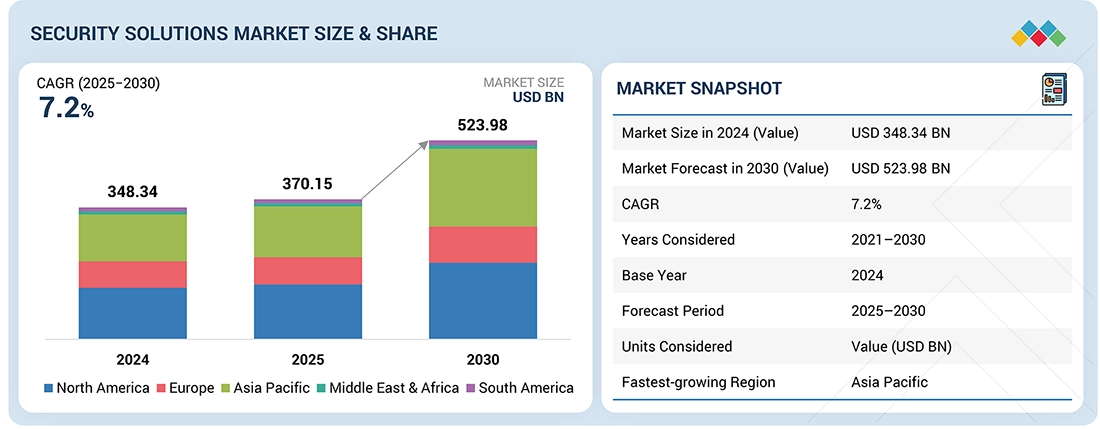
According to Marketsandmarkets, The global security solutions market size was valued at USD 370.15 billion in 2025 and is projected to reach USD 523.98 billion by 2030, growing at a CAGR of 7.2%. from 2025 to 2030. The need to safeguard people, assets, and infrastructure is driving businesses, governments, and institutions to adopt more surveillance systems, access controls, alarm systems, and integrated security technologies. This demand is further fueled by urbanization, the rise of smart cities, and growing public safety concerns, while innovations in AI and IoT continue to improve the efficiency and capabilities of security solutions.
MARKET SNAPSHOT TABLE
| REPORT METRIC | DETAILS |
|---|---|
| Market Size in 2025 (Value) | USD 370.15 Billion |
| Market Forecast in 2030 (Value) | USD 523.98 Billion |
| Growth Rate | CAGR of 7.2% from 2025-2030 |
| Years Considered | 2021–2030 |
| Base Year | 2024 |
| Forecast Period | 2025–2030 |
| Units Considered | Value (USD Million/Billion) |
| Report Coverage | Revenue forecast, company ranking, competitive landscape, growth factors, and trends |
| Top Companies |
|
| Growth Drivers |
|
| Segments Covered |
|
| Regional Scope | North America, Europe, Asia Pacific, Middle East, Latin America, and Africa |
Market Size & Forecast
• 2025 Market Size: USD 370.15 Billion
• 2030 Projected Market Size: USD 523.98 Billion
• CAGR (2025-2030): 7.2%
• Video surveillance system : Highest CAGR
• Asia Pacific : Fastest growing market
SECURITY SOLUTIONS MARKET KEY TAKEAWAYS
-
BY SYSTEMThe system segment includes fire protection system, video surveillance system, access control system, entrance control system, intruder alarm system, and thermal Imaging system. The demand for video surveillance systems in security solutions is driven by rising concerns over crime, theft, and public safety, as well as the need for real-time monitoring and evidence collection.
-
BY SERVICESThe services segment is bifurcated into fire protection services, video surveillance services, access control services, security system integration services, remote monitoring services. The demand for security system integration services is driven by the need for centralized control, improved efficiency, and seamless coordination between multiple security components such as surveillance, access control, alarms, and fire detection
-
BY VERTICALThe vertical is segmented into residential, commercial, government, transportation, retail, banking and finance, education, industrial, energy and utilities, sports and leisure, healthcare, militry and defense. The demand for security solutions in residential settings is growing due to increasing concerns about home burglaries, personal safety, and property protection.
-
BY REGIONAsia Pacific leads the growth in security solutions due to rapid urbanization, expanding infrastructure, and increasing investments in smart cities and technology.
-
COMPETITIVE LANDSCAPEMajor market players have adopted both organic and inorganic strategies, including partnerships and investments. For instance, Emerson Johnson Controls, and Honeywell International Inc. have introduced new security systems.
Security solutions industry are tools and systems designed to protect people, property, and information from threats like theft, unauthorized access, or harm. Industries use them in various ways—retail stores install surveillance and alarm systems, healthcare facilities secure patient data and control access, and manufacturing plants use perimeter security to protect assets. These solutions help reduce risk, ensure safety, and maintain operational integrity across sectors
The Security Solutions Market size is witnessing significant expansion as organizations increasingly prioritize cybersecurity, physical security, and integrated threat management systems. The rising adoption of cloud-based solutions, AI-powered surveillance, and IoT-enabled security devices is contributing to steady Security Solutions Market growth. Key players are capturing a larger Security Solutions Market share by offering innovative, scalable, and customized solutions across industries such as BFSI, healthcare, and government. Current Security Solutions Market trends indicate a focus on convergence between physical and digital security, automation, and real-time threat intelligence, which is reshaping the way businesses approach protection.
The Security Solutions industry is rapidly evolving, driven by increasing concerns over data breaches, cyber-attacks, and workplace safety. Companies investing in advanced access control systems, AI surveillance analytics, and cybersecurity platforms are enhancing their Security Solutions Market share while addressing evolving risks. These developments are strengthening the Security Solutions Market growth, with organizations seeking reliable, integrated solutions for proactive risk management. As demand rises across enterprise, public sector, and critical infrastructure, the Security Solutions Market size is expected to expand further, supported by innovation, regulatory compliance requirements, and the adoption of next-generation security technologies..
Source: Secondary Research, Interviews with Experts, MarketsandMarkets Analysis
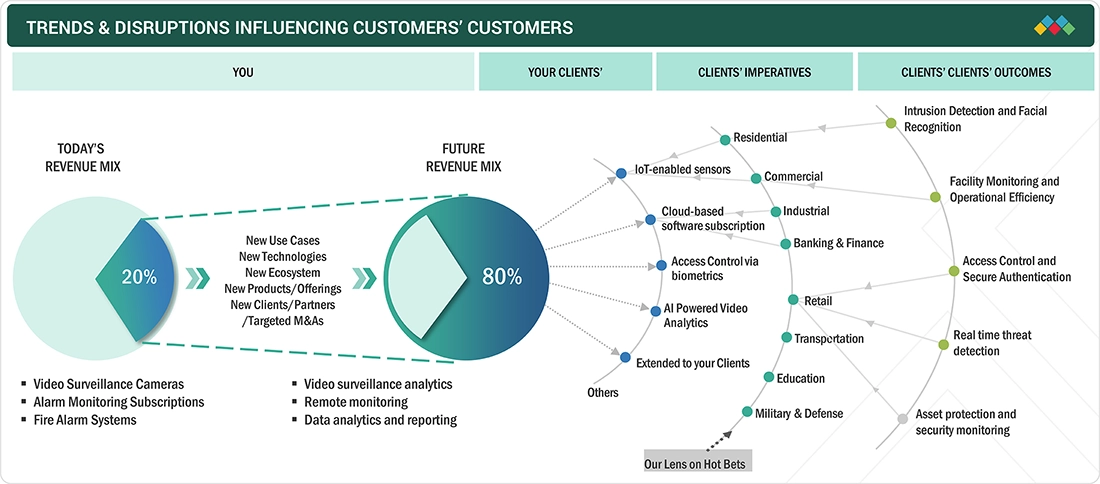
TRENDS & DISRUPTIONS IMPACTING CUSTOMERS' CUSTOMERS
The impact on consumers’ business emerges from customer trends or disruptions. Hot belts are the clients of security solutions providers, and target applications are the clients of security solutions providers. Shifts, which are changing trends or disruptions, will impact the revenues of end users. The revenue impact on end users will affect the revenue of hotbeds, which will further affect the revenues of security solutions providers.
Source: Secondary Research, Interviews with Experts, MarketsandMarkets Analysis
SECURITY SOLUTIONS MARKET DYNAMICS
Drivers
Impact
Level
Level
-
Increasing concerns regarding public safety and infrastructure protection

-
Rapid adoption of AI-powered surveillance and biometric access control is redefining global security standards

RESTRAINTS
Impact
Level
Level
-
Concerns over privacy and data protection regulations

-
Risk of system vulnerabilities and exploits

OPPORTUNITIES
Impact
Level
Level
-
Increasing demand for remote monitoring and surveillance solutions

-
Growing adoption of cloud-based security solutions

CHALLENGES
Impact
Level
Level
-
Risk of rapid technological changes and obsolescence

-
Complex regulatory landscape and compliance challenges

Source: Secondary Research, Interviews with Experts, MarketsandMarkets Analysis
Driver: Rapid adoption of AI-powered surveillance and biometric access control is redefining global security standards
AI-powered surveillance and biometric access control are rapidly transforming the security solutions market by enabling smarter, faster, and more accurate threat detection and access management. These technologies are replacing traditional systems with advanced, data-driven tools that enhance security, reduce human error, and set new industry standards for safety and efficiency.
Restraint:Risk of system vulnerabilities and exploits
As AI-powered surveillance and biometric access systems become more connected and data-driven, they also become potential targets for cyberattacks. People can exploit software flaws, network weaknesses, or improperly secured data to gain unauthorized access, disable systems, or steal sensitive biometric information. Such vulnerabilities not only undermine the effectiveness of the security infrastructure but can also lead to significant financial, legal, and reputational damage..
Opportunity: Increasing demand for remote monitoring and surveillance solutions
As organizations expand their operations across multiple locations and adopt more flexible work models, the need for centralized, real-time oversight has grown significantly. Remote monitoring systems, powered by AI and cloud technologies, allow security teams to access live feeds, receive alerts, and manage incidents from virtually anywhere. This not only enhances situational awareness and response times but also reduces the need for on-site personnel, lowering operational costs.
Challenge: Complex regulatory landscape and compliance challenges
As technologies like AI surveillance and biometric access control collect and process sensitive personal data, they are subject to strict regulations such as GDPR, CCPA, and various regional cybersecurity standards. Meeting these legal requirements often involves implementing robust data governance, securing user consent, ensuring transparency, and maintaining high standards of data security..
Security Solutions Market: COMMERCIAL USE CASES ACROSS INDUSTRIES
| COMPANY | USE CASE DESCRIPTION | BENEFITS |
|---|---|---|
 |
Integrated building security systems including access control, video surveillance, and intrusion detection for commercial and institutional facilities. | Enhanced facility safety, centralized monitoring, and improved operational efficiency. |
 |
AI-powered video analytics, fire detection, and integrated alarm systems for industrial and critical infrastructure security. | Increased threat detection accuracy| Faster response times| Regulatory compliance |
 |
Comprehensive physical security solutions including video surveillance, intrusion alarms, and access control for smart cities and transportation hubs | Reliable security coverage| Scalable systems| Robust data protection |
 |
AI-driven video surveillance cameras and smart analytics for real-time threat detection and perimeter security in retail and public spaces. | High-definition monitoring| Reduced false alarms| Proactive security management |
 |
Residential and commercial security solutions including monitored alarm systems, video surveillance, and remote access control for homes and small businesses. | 24/7 professional monitoring, quick emergency response, and user-friendly remote control.. |
Logos and trademarks shown above are the property of their respective owners. Their use here is for informational and illustrative purposes only.
SECURITY SOLUTIONS MARKET ECOSYSTEM
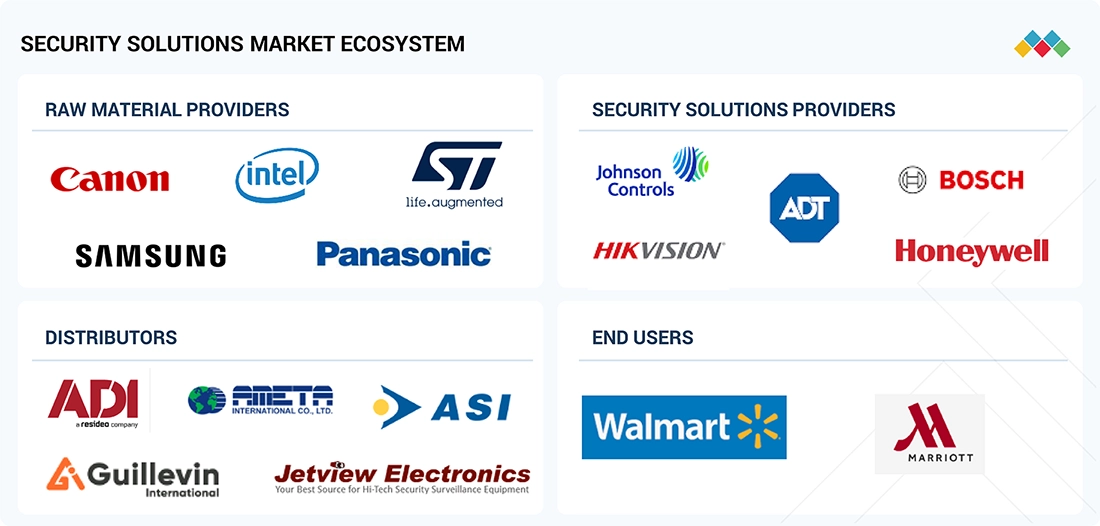
Logos and trademarks shown above are the property of their respective owners. Their use here is for informational and illustrative purposes only.
SECURITY SOLUTIONS MARKET SEGMENTS

Source: Secondary Research, Interviews with Experts, MarketsandMarkets Analysis
Security Solutions Market, By System
The video surveillance system is expected to hold the largest share in the security solutions market by 2025, due to its wide application across various sectors, including commercial, industrial, and public safety. Its ability to provide real-time monitoring, enhanced threat detection through AI analytics, and comprehensive coverage makes it a preferred choice for effective security management. Additionally, advancements in high-definition cameras and remote accessibility further drive its adoption and market dominance..
Security Solutions Market, By Service
Security system integration services are expected to hold the largest share in 2025 as organizations increasingly seek seamless and centralized management of multiple security technologies. These services enable the integration of video surveillance, access control, intrusion detection, and other systems into a unified platform, enhancing operational efficiency and real-time threat response. The growing demand for customized, scalable, and intelligent security solutions across various industries is driving the rapid adoption of integration services.
Security Solutions Market, By Vertical
The commercial vertical is expected to grow the fastest in the security solutions market due to rising security concerns in offices, retail stores, and hospitality sectors. Increasing investments in advanced surveillance, access control, and intrusion detection systems to protect assets, employees, and customers are driving this growth. Additionally, the adoption of smart building technologies and regulatory compliance requirements are further accelerating security upgrades in commercial spaces..
SECURITY SOLUTIONS MARKET By REGION
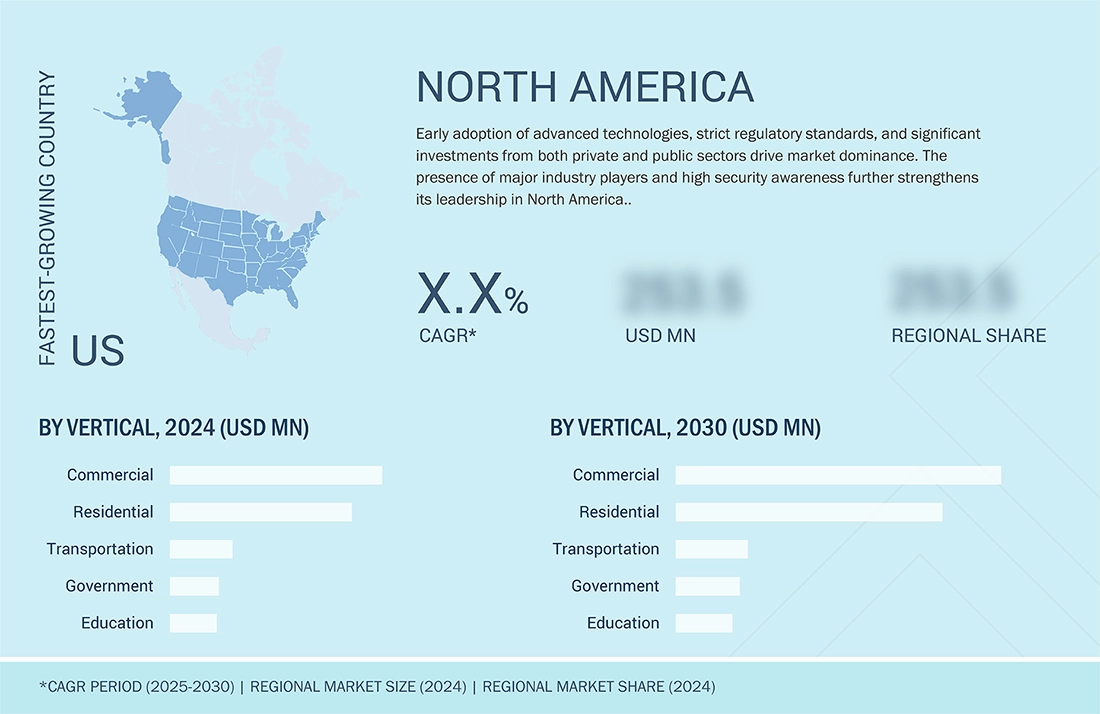
North America to hold the largest market share in the global security solutions market during the forecast period
North America holds the largest share in the security solutions market, driven by early adoption of advanced technologies like AI-powered surveillance and biometric access control. Strong regulatory frameworks, high security awareness, and substantial investments by government and private sectors further boost market growth. Additionally, the presence of major security solution providers and increasing demand across commercial, residential, and critical infrastructure segments contribute to the region’s dominance.
The North American security solutions market is projected to grow from USD 142.9 billion in 2025 to USD 199.7 billion by 2030, at a CAGR of 6.9% during the forecast period. The need to protect people, assets, and infrastructure is prompting businesses, governments, and institutions to adopt more surveillance systems, access controls, alarm systems, and integrated security technologies. This demand is further driven by urbanization, the expansion of smart cities, and increasing public safety concerns, while innovations in AI and IoT continue to enhance the efficiency and capabilities of security solutions.
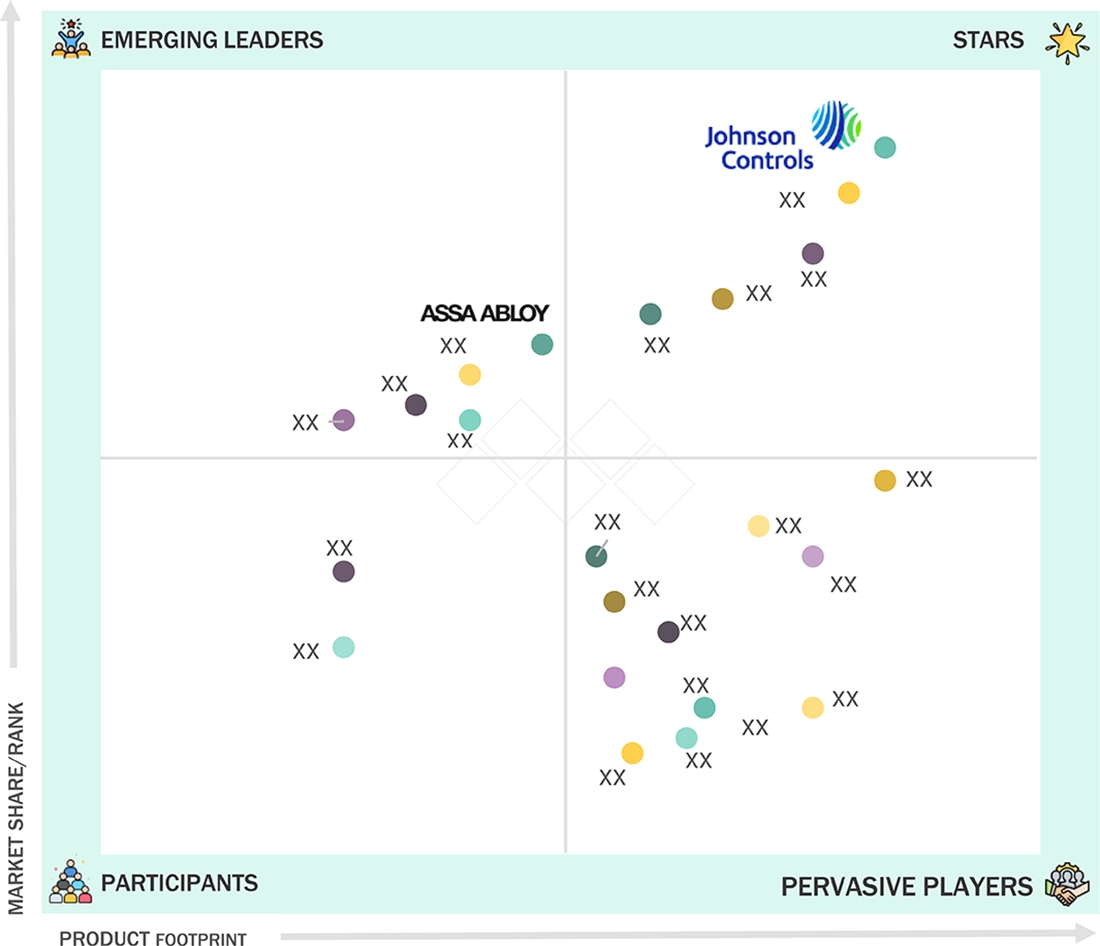
Security Solutions Market: COMPANY EVALUATION MATRIX
Johnson Controls (Star) leads with a comprehensive portfolio of integrated security systems, including access control, video surveillance, and intrusion detection, supporting applications across commercial buildings, healthcare, and education sectors. Known for its innovative technology and strong global presence, Johnson Controls has built robust customer relationships through tailored security solutions and smart building integrations. Assa Abloy (Emerging) is gaining momentum in the security space with its expanding range of advanced locking systems and biometric access control technologies for commercial and residential applications. The security solutions companies is strengthening its market position through strategic acquisitions and partnerships focused on enhancing digital security and smart access solutions.
Source: Secondary Research, Interviews with Experts, MarketsandMarkets Analysis
KEY MARKET PLAYERS
WHAT IS IN IT FOR YOU: Security Solutions Market REPORT CONTENT GUIDE
DELIVERED CUSTOMIZATIONS
We have successfully delivered the following deep-dive customizations:
| CLIENT REQUEST | CUSTOMIZATION DELIVERED | VALUE ADDS |
|---|---|---|
| Market Entry Feasibility Study | Detailed analysis of target market size, growth potential, and competitive landscape for security solutions | Helps clients identify viable markets and optimize investment decisions |
| Technology Trend & Innovation Analysis | Tracking adoption rates and maturity of AI surveillance, biometric access, and cloud-based solutions. | Enables clients to align product development with emerging trends. |
| Competitive Benchmarking & Vendor Profiling |
|
|
| Customer Insights & Demand Analysis |
|
|
RECENT DEVELOPMENTS IN SECURITY SOLUTIONS MARKET
- August 2025 : Johnson Controls launched OpenBlue Visitor, this next-generation platform replaces traditional, manual visitor management systems with a fully digital, secure, and user-friendly solution—from invitation to check-out.
- July 2025 : Hikvision announced the launch of its new DeepinView X-Series Bullet Cameras, powered by advanced Guanlan large-scale AI models. These intelligent cameras offer enhanced perimeter protection by extending video content analysis (VCA) range and significantly reducing false and redundant alarms.
- June 2025 : Honeywell announced the launch of its 50 Series CCTV product line, the company’s first-ever camera portfolio to be locally designed and manufactured.
- March 2025 : Johnson Controls unveiled PowerG+, the next evolution of its trusted PowerG technology. Building on PowerG’s robust foundation, PowerG+ introduces advanced, in-demand features designed to drive the future of security and home automation.
Table of Contents
![]() Exclusive indicates content/data unique to MarketsandMarkets and not available with any competitors.
Exclusive indicates content/data unique to MarketsandMarkets and not available with any competitors.
TITLE
PAGE NO
1
INTRODUCTION
27
2
RESEARCH METHODOLOGY
32
3
EXECUTIVE SUMMARY
43
4
PREMIUM INSIGHTS
47
5
MARKET OVERVIEW
AI-driven surveillance and smart infrastructure fuel security market growth amid privacy and integration challenges.
50
5.1
INTRODUCTION
5.2
MARKET DYNAMICS
5.2.1
DRIVERS
5.2.1.1
INCREASING CONCERNS REGARDING PUBLIC SAFETY AND INFRASTRUCTURE PROTECTION
5.2.1.2
ADOPTION OF AI-POWERED SURVEILLANCE AND BIOMETRIC ACCESS CONTROL
5.2.1.3
RISING INCIDENTS OF THEFT, VANDALISM, AND UNAUTHORIZED ACCESS
5.2.1.4
EXPANSION OF SMART INFRASTRUCTURE AND SMART CITY PROJECTS
5.2.1.5
MODERNIZATION OF PHYSICAL SECURITY AND ACCESS CONTROL SYSTEMS
5.2.2
RESTRAINTS
5.2.2.1
CONCERNS REGARDING PRIVACY AND DATA PROTECTION REGULATIONS
5.2.2.2
RISKS ASSOCIATED WITH UNAUTHORIZED ACCESS
5.2.2.3
COMPLEXITY OF INTEGRATING MODERN SECURITY SOLUTIONS WITH EXISTING INFRASTRUCTURE
5.2.3
OPPORTUNITIES
5.2.3.1
INCREASING ADOPTION OF REMOTE MONITORING
5.2.3.2
DEPLOYMENT OF CLOUD-BASED SECURITY SOLUTIONS
5.2.3.3
EXPANSION OF SECURITY REQUIREMENTS IN RETAIL AND COMMERCIAL SECTORS
5.2.3.4
RAPID URBANIZATION IN DEVELOPED COUNTRIES
5.2.4
CHALLENGES
5.2.4.1
COMPETITIVE PRESSURE FOR TECHNOLOGICAL UPDATES
5.2.4.2
COMPLEX REGULATORY LANDSCAPE AND COMPLIANCE CHALLENGES
5.2.4.3
HIGH INITIAL COSTS
5.3
VALUE CHAIN ANALYSIS
5.4
ECOSYSTEM ANALYSIS
5.5
INVESTMENT AND FUNDING SCENARIO
5.6
PRICING ANALYSIS
5.6.1
PRICING RANGE OF SECURITY SOLUTIONS OFFERED BY KEY PLAYERS, BY SYSTEM, 2024
5.6.2
AVERAGE SELLING PRICE TREND OF SECURITY SOLUTIONS, BY SYSTEM, 2020–2024
5.6.3
AVERAGE SELLING PRICE TREND OF SECURITY SOLUTIONS, BY REGION, 2020–2024
5.7
TRENDS/DISRUPTIONS IMPACTING CUSTOMER BUSINESS
5.8
TECHNOLOGY ANALYSIS
5.8.1
KEY TECHNOLOGIES
5.8.1.1
VIDEO SURVEILLANCE
5.8.1.2
BIOMETRICS
5.8.1.3
AI AND ML
5.8.1.4
WIRELESS TECHNOLOGIES
5.8.2
COMPLEMENTARY TECHNOLOGIES
5.8.2.1
INTEGRATED SECURITY MANAGEMENT SYSTEMS
5.8.2.2
PHYSICAL AND CYBER CONVERGENCE
5.8.2.3
GIS INTEGRATION
5.8.2.4
INCIDENT RESPONSE PLATFORMS
5.8.3
ADJACENT TECHNOLOGIES
5.8.3.1
IOT SECURITY
5.8.3.2
EDGE COMPUTING SECURITY
5.8.3.3
BEHAVIORAL ANALYTICS
5.9
PORTER'S FIVE FORCES ANALYSIS
5.10
KEY STAKEHOLDERS AND BUYING CRITERIA
5.11
KEY STAKEHOLDERS IN BUYING PROCESS
5.12
BUYING CRITERIA
5.13
CASE STUDY ANALYSIS
5.13.1
AUTOMATED SURVEILLANCE SYSTEM ENHANCES THREAT DETECTION AND RESPONSE FOR FPSO OPERATIONS
5.13.2
HONEYWELL DELIVERS ADVANCED FIRE AND SECURITY ECOSYSTEM FOR DUBAI MALL
5.13.3
BOSCH DEPLOYS INTELLIGENT VIDEO SURVEILLANCE SYSTEM FOR STADIUM-WIDE SECURITY
5.13.4
AXIS COMMUNICATIONS DELIVERS INTEGRATED VIDEO SURVEILLANCE ACROSS THE SHARD
5.13.5
AVIGILON ALTA SOLUTION UNIFIES AND STRENGTHENS VIDEO SURVEILLANCE FOR SUPERDRY
5.14
TRADE ANALYSIS
5.14.1
IMPORT SCENARIO (HS CODE 854231)
5.14.2
EXPORT SCENARIO (HS CODE 854231)
5.15
PATENT ANALYSIS
5.16
KEY CONFERENCES AND EVENTS, 2025–2027
5.17
TARIFF ANALYSIS
5.18
STANDARDS AND REGULATORY LANDSCAPE
5.18.1
REGULATORY BODIES, GOVERNMENT AGENCIES, AND OTHER ORGANIZATIONS
5.18.2
STANDARDS AND REGULATIONS RELATED TO SECURITY SOLUTIONS MARKET
5.18.2.1
ISO 27001 - INFORMATION SECURITY MANAGEMENT
5.18.2.2
UL 2900 - STANDARD FOR SOFTWARE CYBERSECURITY FOR NETWORK-CONNECTABLE PRODUCTS
5.18.2.3
EN 50130 SERIES - ALARM SYSTEMS
5.18.2.4
BS EN 50131 SERIES - ALARM SYSTEMS
5.18.2.5
IEC 62676
5.18.3
GOVERNMENT REGULATIONS
5.18.3.1
US
5.18.3.2
CANADA
5.18.3.3
EUROPE
5.18.3.4
UK
5.18.3.5
JAPAN
5.18.3.6
INDIA
5.19
IMPACT OF AI/GEN AI ON SECURITY SOLUTIONS MARKET
5.19.1
INTRODUCTION
5.20
IMPACT OF 2025 US TARIFF ON SECURITY SOLUTIONS MARKET
5.20.1
INTRODUCTION
5.20.2
KEY TARIFF RATES
5.20.3
PRICE IMPACT ANALYSIS
5.20.4
IMPACT ON COUNTRIES/REGIONS
5.20.4.1
US
5.20.4.2
EUROPE
5.20.4.3
ASIA PACIFIC
5.20.5
IMPACT ON VERTICALS
6
FUTURE OF PHYSICAL SECURITY
AI-driven solutions redefine security landscapes, integrating physical and cyber measures in smart cities.
89
6.1
INTRODUCTION
6.2
ROLE OF AI, DRONES, AND ROBOTICS IN NEXT-GEN SECURITY
6.3
EMERGENCE OF SMART CITIES
6.4
CONVERGENCE OF PHYSICAL AND CYBERSECURITY
6.5
TRENDS IN PREDICTIVE ANALYTICS FOR THREAT PREVENTION
7
SECURITY SOLUTIONS MARKET, BY SYSTEM
Market Size & Growth Rate Forecast Analysis to 2030 in USD Million | 42 Data Tables
92
7.1
INTRODUCTION
7.2
FIRE PROTECTION SYSTEMS
7.2.1
FIRE SUPPRESSION SYSTEMS
7.2.1.1
GROWING TREND OF MODULAR AND ADAPTABLE FIRE SUPPRESSION SOLUTIONS TO DRIVE MARKET
7.2.2
FIRE SPRINKLERS
7.2.2.1
RISING DEMAND FOR ENVIRONMENTALLY CONSCIOUS FIRE SUPPRESSION SOLUTIONS TO FUEL MARKET GROWTH
7.2.3
FIRE DETECTION SYSTEMS
7.2.3.1
INCREASING AWARENESS OF FIRE HAZARDS TO DRIVE MARKET
7.2.4
FIRE ANALYTICS SYSTEMS
7.2.4.1
INTEGRATION OF IOT AND CLOUD-BASED PLATFORMS TO SUPPORT MARKET GROWTH
7.2.5
FIRE RESPONSE SYSTEMS
7.2.5.1
ADOPTION OF INTEGRATED AND DATA-DRIVEN FIRE RESPONSE SOLUTIONS TO FUEL MARKET GROWTH
7.3
VIDEO SURVEILLANCE SYSTEMS
7.3.1
CAMERAS
7.3.1.1
INCREASING ADOPTION OF AI-ENABLED IP CAMERAS TO BOOST DEMAND
7.3.1.2
IP CAMERAS AND ANALYTICS
7.3.1.3
PTZ AND FIXED CAMERAS
7.3.2
MONITORS
7.3.2.1
GROWING DEMAND FOR TOUCHSCREEN AND INTERACTIVE MONITORS TO SUPPORT MARKET GROWTH
7.3.3
STORAGE DEVICES
7.3.3.1
RISING USE OF HIGH-RESOLUTION 4K AND 8K CAMERAS TO DRIVE MARKET
7.3.4
ACCESSORIES
7.3.4.1
INCREASING DEPLOYMENT OF WEATHER-RESISTANT MOUNTS AND ENCLOSURES TO BOOST DEMAND
7.3.5
SOFTWARE
7.3.5.1
DEPLOYMENT OF AI-POWERED VIDEO MANAGEMENT SOFTWARE TO OFFER GROWTH OPPORTUNITIES
7.4
ACCESS CONTROL SYSTEMS
7.4.1
CARD-BASED READERS
7.4.1.1
INCREASING DEPLOYMENT IN CORPORATE OFFICES, EDUCATIONAL INSTITUTIONS, AND GOVERNMENT FACILITIES TO DRIVE MARKET GROWTH
7.4.2
BIOMETRIC READERS
7.4.2.1
GROWING ADOPTION OF FINGERPRINT RECOGNITION TO FUEL MARKET GROWTH
7.4.3
MULTI-TECHNOLOGY READERS
7.4.3.1
FLEXIBILITY FOR VISITOR MANAGEMENT AND ACCESS ACROSS MULTIPLE SITES TO OFFER GROWTH OPPORTUNITIES
7.4.4
ELECTRONIC LOCKS
7.4.4.1
GROWTH IN SMART LOCK INSTALLATIONS FOR OFFICES AND RESIDENCES TO FUEL MARKET GROWTH
7.4.5
ACCESS CONTROLLERS
7.4.5.1
NEED FOR ENHANCED SECURITY ACROSS DIVERSE SECURITY ENVIRONMENTS TO BOOST DEMAND
7.4.6
SOFTWARE SOLUTIONS
7.4.6.1
RISING USE OF AI AND PREDICTIVE ANALYTICS FOR THREAT DETECTION TO SUPPORT MARKET GROWTH
7.4.7
OTHERS
7.5
ENTRANCE CONTROL SYSTEMS
7.5.1
INTEGRATION WITH VIDEO SURVEILLANCE AND SECURITY PLATFORMS TO OFFER LUCRATIVE GROWTH OPPORTUNITIES
7.6
INTRUDER ALARM SYSTEMS
7.6.1
RISING CONCERNS OVER THEFT, VANDALISM, AND UNAUTHORIZED ACCESS TO FUEL SEGMENTAL GROWTH
7.7
THERMAL IMAGING SYSTEMS
7.7.1
THERMAL CAMERAS
7.7.1.1
GROWING APPLICATION IN BORDER SECURITY AND CRITICAL INFRASTRUCTURE PROTECTION TO BOOST DEMAND
7.7.2
THERMAL MODULES
7.7.2.1
ENHANCED DETECTION, TRACKING, AND ANALYSIS WITH THERMAL IMAGING INTO EXISTING INFRASTRUCTURE TO DRIVE MARKET
8
SECURITY SOLUTIONS MARKET, BY SERVICE
Market Size & Growth Rate Forecast Analysis to 2030 in USD Million | 22 Data Tables
122
8.1
INTRODUCTION
8.2
FIRE PROTECTION SERVICES
8.2.1
MAINTENANCE SERVICES
8.2.1.1
GROWING APPLICATION IN RESIDENTIAL COMPLEXES, PUBLIC VENUES, AND TRANSPORTATION HUBS TO FUEL MARKET GROWTH
8.2.2
MANAGED SERVICES
8.2.2.1
OPTIMIZED FIRE PROTECTION PERFORMANCE TO DRIVE MARKET
8.2.3
INSTALLATION AND DESIGN SERVICES
8.2.3.1
GROWING IMPORTANCE OF CUSTOMIZED FIRE PROTECTION SOLUTIONS TO FOSTER MARKET GROWTH
8.2.4
ENGINEERING SERVICES
8.2.4.1
RISING DEMAND FOR INTEGRATED AND ADAPTIVE FIRE SAFETY APPROACHES TO SUPPORT MARKET GROWTH
8.2.5
OTHER SERVICES
8.3
VIDEO SURVEILLANCE SERVICES
8.3.1
VSAAS
8.3.1.1
RISING DEMAND FOR CLOUD-BASED SURVEILLANCE SOLUTIONS TO OFFER GROWTH OPPORTUNITIES
8.3.2
INSTALLATION AND MAINTENANCE
8.3.2.1
REDUCED RISK OF FAILURES DURING CRITICAL EVENTS TO AUGMENT MARKET GROWTH
8.4
ACCESS CONTROL SERVICES
8.4.1
INSTALLATION AND INTEGRATION
8.4.1.1
ENHANCED PROTECTION FOR ASSETS, PERSONNEL, AND SENSITIVE INFORMATION TO FUEL MARKET GROWTH
8.4.2
SUPPORT AND MAINTENANCE
8.4.2.1
GROWING IMPROVEMENT-RELATED INITIATIVES TO BOOST DEMAND
8.5
SECURITY SYSTEM INTEGRATION SERVICES
8.5.1
ENHANCED REAL-TIME MONITORING, INCIDENT DETECTION, AND COORDINATED RESPONSES TO FUEL MARKET GROWTH
8.6
REMOTE MONITORING SERVICES
8.6.1
INCREASING DEMAND FOR REAL-TIME SURVEILLANCE TO SUPPORT MARKET GROWTH
9
SECURITY SOLUTIONS MARKET, BY VERTICAL
Market Size & Growth Rate Forecast Analysis to 2030 in USD Million | 26 Data Tables
138
9.1
INTRODUCTION
9.2
RESIDENTIAL
9.2.1
INCREASING DEMAND FOR CONVENIENCE AND AUTOMATION TO BENEFIT MARKET
9.2.1.1
SMART HOME SECURITY
9.2.1.2
GATED COMMUNITY SOLUTIONS
9.3
COMMERCIAL
9.3.1
ADOPTION OF AI, CLOUD PLATFORMS, AND BIOMETRIC SOLUTIONS TO OFFER GROWTH OPPORTUNITIES
9.3.2
CORPORATE OFFICES AND FACILITIES
9.3.2.1
EMPLOYEE ACCESS MANAGEMENT
9.3.2.2
VISITOR MANAGEMENT SYSTEM
9.3.2.3
ASSET PROTECTION
9.3.2.4
COMPLIANCE MANAGEMENT
9.3.3
MALLS
9.4
GOVERNMENT
9.4.1
INCREASING THREATS OF TERRORISM AND CYBER-PHYSICAL ATTACKS IN PUBLIC SPACES TO BOOST DEMAND
9.4.2
CITY SURVEILLANCE
9.4.3
COURTS AND PRISONS
9.5
TRANSPORTATION
9.5.1
NEED FOR INTEGRATED, INTELLIGENT, AND SCALABLE SECURITY SYSTEMS TO FOSTER MARKET GROWTH
9.5.2
AIRPORTS
9.5.3
RAILWAYS
9.5.4
MARITIME
9.5.5
CARGO AND WAREHOUSE SECURITY
9.6
RETAIL
9.6.1
ADOPTION OF AI-POWERED VIDEO ANALYTICS TO ENABLE REAL-TIME MONITORING TO FUEL MARKET GROWTH
9.6.2
LOSS PREVENTION SYSTEM
9.6.3
POS SECURITY
9.6.4
INVENTORY PROTECTION
9.7
BANKING AND FINANCE
9.7.1
NEED TO SAFEGUARD PHYSICAL BRANCHES AND ONLINE ASSETS TO DRIVE MARKET
9.7.2
BRANCH SECURITY SOLUTIONS
9.7.3
ATM SECURITY SOLUTIONS
9.7.4
DATA CENTER PROTECTION
9.8
EDUCATION
9.8.1
SMART CAMPUS INITIATIVES TO OFFER GROWTH OPPORTUNITIES
9.8.2
CAMPUS SECURITY
9.8.3
RESEARCH AND FACILITY
9.9
INDUSTRIAL
9.9.1
GROWING INCIDENTS OF THEFT, SABOTAGE, AND WORKPLACE ACCIDENTS TO DRIVE MARKET
9.9.2
MANUFACTURING PLANTS
9.9.3
WAREHOUSES
9.10
ENERGY & UTILITIES
9.10.1
RISING RENEWABLE ENERGY INFRASTRUCTURE TO FUEL MARKET GROWTH
9.11
SPORTS & LEISURE
9.11.1
EMPHASIS ON SAFEGUARDING STADIUMS, ARENAS, AND RECREATION CENTERS TO FOSTER MARKET GROWTH
9.12
HEALTHCARE
9.12.1
ADOPTION OF INTELLIGENT SECURITY SOLUTIONS TO SUPPORT MARKET GROWTH
9.12.2
HOSPITALITY SECURITY SYSTEMS
9.12.3
PHARMACEUTICAL SECURITY
9.13
MILITARY & DEFENSE
9.13.1
EVOLVING SECURITY THREATS TO BOOST DEMAND
9.13.2
BORDER SECURITY
9.13.3
LAW ENFORCEMENT SOLUTIONS
10
SECURITY SOLUTIONS MARKET, BY REGION
Comprehensive coverage of 8 Regions with country-level deep-dive of 21 Countries | 62 Data Tables.
163
10.1
INTRODUCTION
10.2
NORTH AMERICA
10.2.1
MACROECONOMIC OUTLOOK FOR NORTH AMERICA
10.2.2
US
10.2.2.1
GROWING URBAN CRIME TO BOOST DEMAND
10.2.3
CANADA
10.2.3.1
SHIFT TOWARD INTEGRATED AND CLOUD-ENABLED SOLUTIONS TO FOSTER MARKET GROWTH
10.2.4
MEXICO
10.2.4.1
GOVERNMENT-LED INITIATIVES AND INVESTMENTS IN PUBLIC SAFETY TO DRIVE MARKET
10.3
EUROPE
10.3.1
MACROECONOMIC OUTLOOK FOR EUROPE
10.3.2
GERMANY
10.3.2.1
EMPHASIS ON INDUSTRY 4.0 TO OFFER GROWTH OPPORTUNITIES
10.3.3
UK
10.3.3.1
INCREASING EMPHASIS ON SECURE INFRASTRUCTURE TO DRIVE MARKET
10.3.4
FRANCE
10.3.4.1
RISING ADOPTION OF AI-POWERED SECURITY SOLUTIONS FOR INDUSTRIAL AND COMMERCIAL SECTORS TO PROPEL MARKET GROWTH
10.3.5
ITALY
10.3.5.1
ADOPTION OF SMART BUILDING TECHNOLOGIES TO FUEL MARKET GROWTH
10.3.6
SPAIN
10.3.6.1
PUSH TOWARD DIGITAL TRANSFORMATION TO FOSTER MARKET GROWTH
10.3.7
NORDICS
10.3.7.1
CONVERGENCE OF TECHNOLOGICAL INNOVATION TO OFFER GROWTH OPPORTUNITIES
10.3.8
REST OF EUROPE
10.4
ASIA PACIFIC
10.4.1
MACROECONOMIC OUTLOOK FOR ASIA PACIFIC
10.4.2
CHINA
10.4.2.1
EXPANSION OF SMART CITY INITIATIVES TO SUPPORT MARKET GROWTH
10.4.3
JAPAN
10.4.3.1
EMPHASIS ON UPGRADING SAFETY IN TRANSPORTATION NETWORKS TO DRIVE MARKET
10.4.4
SOUTH KOREA
10.4.4.1
INCREASING FOCUS ON SMART INFRASTRUCTURE TO FUEL MARKET GROWTH
10.4.5
INDIA
10.4.5.1
RAPID URBANIZATION TO OFFER GROWTH OPPORTUNITIES
10.4.6
AUSTRALIA
10.4.6.1
INCREASING SAFETY STANDARDS ACROSS INDUSTRIAL FACILITIES TO FUEL MARKET GROWTH
10.4.7
INDONESIA
10.4.7.1
RISING DEMAND FOR MODERN VIDEO SURVEILLANCE AND ACCESS CONTROL SYSTEMS TO FOSTER MARKET GROWTH
10.4.8
MALAYSIA
10.4.8.1
INCREASING ADOPTION OF AI-BASED MONITORING AND ROBOTIC SECURITY TO BOOST DEMAND
10.4.9
THAILAND
10.4.9.1
GROWING TOURISM TO BOOST DEMAND
10.4.10
VIETNAM
10.4.10.1
INCREASING INVESTMENT IN INFRASTRUCTURE PROJECTS TO DRIVE MARKET
10.4.11
REST OF ASIA PACIFIC
10.5
ROW
10.5.1
MACROECONOMIC OUTLOOK FOR ROW
10.5.2
MIDDLE EAST
10.5.2.1
SAUDI ARABIA
10.5.2.2
UAE
10.5.2.3
QATAR
10.5.2.4
KUWAIT
10.5.2.5
OMAN
10.5.2.6
BAHRAIN
10.5.2.7
REST OF MIDDLE EAST
10.5.3
SOUTH AMERICA
10.5.3.1
RISING TECHNOLOGICAL INNOVATION TO FOSTER MARKET GROWTH
10.5.4
AFRICA
10.5.5
SOUTH AFRICA
10.5.5.1
NEED TO PROTECT CRITICAL INFRASTRUCTURE TO BOOST DEMAND
10.5.6
REST OF AFRICA
11
COMPETITIVE LANDSCAPE
Uncover strategic maneuvers and market dominance shaping the competitive landscape through 2025.
204
11.1
OVERVIEW
11.2
KEY PLAYER STRATEGIES/RIGHT TO WIN, 2021–2025
11.3
REVENUE ANALYSIS, 2020–2024
11.4
MARKET SHARE ANALYSIS, 2O24
11.5
COMPANY VALUATION AND FINANCIAL METRICS
11.6
BRAND COMPARISON
11.7
COMPANY EVALUATION MATRIX: KEY PLAYERS, 2024
11.7.1
STARS
11.7.2
EMERGING LEADERS
11.7.3
PERVASIVE PLAYERS
11.7.4
PARTICIPANTS
11.7.5
COMPANY FOOTPRINT: KEY PLAYERS, 2024
11.7.5.1
COMPANY FOOTPRINT
11.7.5.2
REGION FOOTPRINT
11.7.5.3
SYSTEM FOOTPRINT
11.7.5.4
SERVICE FOOTPRINT
11.7.5.5
VERTICAL FOOTPRINT
11.8
COMPANY EVALUATION MATRIX: STARTUPS/SMES, 2024
11.8.1
PROGRESSIVE COMPANIES
11.8.2
RESPONSIVE COMPANIES
11.8.3
DYNAMIC COMPANIES
11.8.4
STARTING BLOCKS
11.8.5
COMPETITIVE BENCHMARKING: STARTUPS/SMES, 2024
11.8.5.1
DETAILED LIST OF KEY STARTUPS/SMES
11.8.5.2
COMPETITIVE BENCHMARKING OF KEY STARTUPS/SMES
11.9
COMPETITIVE SCENARIO
11.9.1
PRODUCT LAUNCHES
11.9.2
DEALS
12
COMPANY PROFILES
In-depth Company Profiles of Leading Market Players with detailed Business Overview, Product and Service Portfolio, Recent Developments, and Unique Analyst Perspective (MnM View)
227
12.1
KEY PLAYERS
12.1.1
JOHNSON CONTROLS
12.1.1.1
BUSINESS OVERVIEW
12.1.1.2
PRODUCTS/SOLUTIONS/SERVICES OFFERED
12.1.1.3
RECENT DEVELOPMENTS
12.1.1.4
MNM VIEW
12.1.2
HONEYWELL INTERNATIONAL INC.
12.1.3
ROBERT BOSCH GMBH
12.1.4
ADT SECURITY SERVICES
12.1.5
HANGZHOU HIKVISION DIGITAL TECHNOLOGY CO., LTD
12.1.6
AXIS COMMUNICATIONS AB
12.1.7
DAHUA TECHNOLOGY CO., LTD
12.1.8
SECOM CO., LTD
12.1.9
SIEMENS
12.1.10
ASSA ABLOY
12.1.11
KEENFINITY
12.2
OTHER PLAYERS
12.2.1
HALMA PLC
12.2.2
HOCHIKI CORPORATION
12.2.3
DORMAKABA GROUP
12.2.4
TELEDYNE FLIR LLC
12.2.5
ALLEGION PLC
12.2.6
NICE S.P.A.
12.2.7
GODREJ GROUP
12.2.8
ALARM.COM
12.2.9
MOTOROLA SOLUTIONS, INC.
12.2.10
DALLMEIER ELECTRONIC GMBH & CO KG
12.2.11
SECURITAS TECHNOLOGY
12.2.12
GUNNEBO AB
12.2.13
BRIVO SYSTEMS, LLC
12.2.14
BRINKS HOME
12.2.15
VERKADA INC.
13
APPENDIX
278
13.1
INSIGHTS FROM INDUSTRY EXPERTS
13.2
DISCUSSION GUIDE
13.3
KNOWLEDGESTORE: MARKETSANDMARKETS’ SUBSCRIPTION PORTAL
13.4
AVAILABLE CUSTOMIZATIONS
13.5
RELATED REPORTS
13.6
AUTHOR DETAILS
LIST OF TABLES
TABLE 1
LIST OF SECONDARY SOURCES
TABLE 2
SECURITY SOLUTIONS MARKET: ROLE OF KEY PLAYERS IN ECOSYSTEM
TABLE 3
PRICING RANGE OF SECURITY SOLUTIONS OFFERED BY KEY PLAYERS, BY SYSTEM, 2024
TABLE 4
AVERAGE SELLING PRICE TREND OF SECURITY SOLUTIONS, BY SYSTEM, 2020–2024
TABLE 5
AVERAGE SELLING PRICE TREND OF SECURITY SOLUTIONS, BY REGION, 2020–2024
TABLE 6
SECURITY SOLUTIONS MARKET: PORTER'S FIVE FORCES ANALYSIS
TABLE 7
INFLUENCE OF STAKEHOLDERS ON BUYING PROCESS, BY VERTICAL (%)
TABLE 8
KEY BUYING CRITERIA FOR VERTICALS
TABLE 9
IMPORT DATA FOR HS CODE 854231-COMPLIANT PRODUCTS, BY COUNTRY, 2020–2024 (USD MILLION)
TABLE 10
EXPORT DATA FOR HS CODE 854231-COMPLIANT PRODUCTS, BY COUNTRY, 2020–2024 (USD MILLION)
TABLE 11
PATENTS APPLIED AND GRANTED, 2023–2025
TABLE 12
SECURITY SOLUTIONS MARKET: CONFERENCES AND EVENTS, 2025–2027
TABLE 13
MFN TARIFF FOR HS CODE 854231-COMPLIANT PRODUCTS EXPORTED BY US
TABLE 14
NORTH AMERICA: LIST OF REGULATORY BODIES, GOVERNMENT AGENCIES, AND OTHER ORGANIZATIONS
TABLE 15
EUROPE: LIST OF REGULATORY BODIES, GOVERNMENT AGENCIES, AND OTHER ORGANIZATIONS
TABLE 16
ASIA PACIFIC: LIST OF REGULATORY BODIES, GOVERNMENT AGENCIES, AND OTHER ORGANIZATIONS
TABLE 17
ROW: LIST OF REGULATORY BODIES, GOVERNMENT AGENCIES, AND OTHER ORGANIZATIONS
TABLE 18
US-ADJUSTED RECIPROCAL TARIFF RATES
TABLE 19
SECURITY SOLUTIONS MARKET, BY SYSTEM, 2021–2024 (USD MILLION)
TABLE 20
SECURITY SOLUTIONS MARKET, BY SYSTEM, 2025–2030 (USD MILLION)
TABLE 21
FIRE PROTECTION SYSTEMS: SECURITY SOLUTIONS MARKET, BY TYPE, 2021–2024 (USD MILLION)
TABLE 22
FIRE PROTECTION SYSTEMS: SECURITY SOLUTIONS MARKET, BY TYPE, 2025–2030 (USD MILLION)
TABLE 23
FIRE PROTECTION SYSTEMS: SECURITY SOLUTIONS MARKET, BY REGION, 2021–2024 (USD MILLION)
TABLE 24
FIRE PROTECTION SYSTEMS: SECURITY SOLUTIONS MARKET, BY REGION, 2025–2030 (USD MILLION)
TABLE 25
FIRE SUPPRESSION SYSTEMS: SECURITY SOLUTIONS MARKET, BY REGION, 2021–2024 (USD MILLION)
TABLE 26
FIRE SUPPRESSION SYSTEMS: SECURITY SOLUTIONS MARKET, BY REGION, 2025–2030 (USD MILLION)
TABLE 27
FIRE SPRINKLERS: SECURITY SOLUTIONS MARKET, BY REGION, 2021–2024 (USD MILLION)
TABLE 28
FIRE SPRINKLERS: SECURITY SOLUTIONS MARKET, BY REGION, 2025–2030 (USD MILLION)
TABLE 29
FIRE DETECTION SYSTEMS: SECURITY SOLUTIONS MARKET, BY REGION, 2021–2024 (USD MILLION)
TABLE 30
FIRE DETECTION SYSTEMS: SECURITY SOLUTIONS MARKET, BY REGION, 2025–2030 (USD MILLION)
TABLE 31
FIRE ANALYTICS SOLUTIONS: SECURITY SOLUTIONS MARKET, BY REGION, 2021–2024 (USD MILLION)
TABLE 32
FIRE ANALYTICS SOLUTIONS: SECURITY SOLUTIONS MARKET, BY REGION, 2025–2030 (USD MILLION)
TABLE 33
FIRE RESPONSE SYSTEMS: SECURITY SOLUTIONS MARKET, BY REGION, 2021–2024 (USD MILLION)
TABLE 34
FIRE RESPONSE SYSTEMS: SECURITY SOLUTIONS MARKET, BY REGION, 2025–2030 (USD MILLION)
TABLE 35
VIDEO SURVEILLANCE SYSTEMS: SECURITY SOLUTIONS MARKET, BY TYPE, 2021–2024 (USD MILLION)
TABLE 36
VIDEO SURVEILLANCE SYSTEMS: SECURITY SOLUTIONS MARKET, BY TYPE, 2025–2030 (USD MILLION)
TABLE 37
VIDEO SURVEILLANCE SYSTEMS: SECURITY SOLUTIONS MARKET, BY REGION, 2021–2024 (USD MILLION)
TABLE 38
VIDEO SURVEILLANCE SYSTEMS: SECURITY SOLUTIONS MARKET, BY REGION, 2025–2030 (USD MILLION)
TABLE 39
CAMERAS: SECURITY SOLUTIONS MARKET, BY REGION, 2021–2024 (USD MILLION)
TABLE 40
CAMERAS: SECURITY SOLUTIONS MARKET, BY REGION, 2025–2030 (USD MILLION)
TABLE 41
MONITORS: SECURITY SOLUTIONS MARKET, BY REGION, 2021–2024 (USD MILLION)
TABLE 42
MONITORS: SECURITY SOLUTIONS MARKET, BY REGION, 2025–2030 (USD MILLION)
TABLE 43
STORAGE DEVICES: SECURITY SOLUTIONS MARKET, BY REGION, 2021–2024 (USD MILLION)
TABLE 44
STORAGE DEVICES: SECURITY SOLUTIONS MARKET, BY REGION, 2025–2030 (USD MILLION)
TABLE 45
ACCESSORIES: SECURITY SOLUTIONS MARKET, BY REGION, 2021–2024 (USD MILLION)
TABLE 46
ACCESSORIES: SECURITY SOLUTIONS MARKET, BY REGION, 2025–2030 (USD MILLION)
TABLE 47
SOFTWARE: SECURITY SOLUTIONS MARKET, BY REGION, 2021–2024 (USD MILLION)
TABLE 48
SOFTWARE: SECURITY SOLUTIONS MARKET, BY REGION, 2025–2030 (USD MILLION)
TABLE 49
ACCESS CONTROL SYSTEMS: SECURITY SOLUTIONS MARKET, BY TYPE, 2021–2024 (USD MILLION)
TABLE 50
ACCESS CONTROL SYSTEMS: SECURITY SOLUTIONS MARKET, BY TYPE, 2025–2030 (USD MILLION)
TABLE 51
ACCESS CONTROL SYSTEMS: SECURITY SOLUTIONS MARKET, BY REGION, 2021–2024 (USD MILLION)
TABLE 52
ACCESS CONTROL SYSTEMS: SECURITY SOLUTIONS MARKET, BY REGION, 2025–2030 (USD MILLION)
TABLE 53
ENTRANCE CONTROL SYSTEMS: SECURITY SOLUTIONS MARKET, BY REGION, 2021–2024 (USD MILLION)
TABLE 54
ENTRANCE CONTROL SYSTEMS: SECURITY SOLUTIONS MARKET, BY REGION, 2025–2030 (USD MILLION)
TABLE 55
INTRUDER ALARM SYSTEMS: SECURITY SOLUTIONS MARKET, BY REGION, 2021–2024 (USD MILLION)
TABLE 56
INTRUDER ALARM SYSTEMS: SECURITY SOLUTIONS MARKET, BY REGION, 2025–2030 (USD MILLION)
TABLE 57
THERMAL IMAGING SYSTEMS: SECURITY SOLUTIONS MARKET, BY TYPE, 2021–2024 (USD MILLION)
TABLE 58
THERMAL IMAGING SYSTEMS: SECURITY SOLUTIONS MARKET, BY TYPE, 2025–2030 (USD MILLION)
TABLE 59
THERMAL IMAGING SYSTEMS: SECURITY SOLUTIONS MARKET, BY REGION, 2021–2024 (USD MILLION)
TABLE 60
THERMAL IMAGING SYSTEMS: SECURITY SOLUTIONS MARKET, BY REGION, 2025–2030 (USD MILLION)
TABLE 61
SECURITY SOLUTIONS MARKET, BY SERVICE, 2021–2024 (USD MILLION)
TABLE 62
SECURITY SOLUTIONS MARKET, BY SERVICE, 2025–2030 (USD MILLION)
TABLE 63
FIRE PROTECTION SERVICES: SECURITY SOLUTIONS MARKET, BY TYPE, 2021–2024 (USD MILLION)
TABLE 64
FIRE PROTECTION SERVICES: SECURITY SOLUTIONS MARKET, BY TYPE, 2025–2030 (USD MILLION)
TABLE 65
FIRE PROTECTION SERVICES: SECURITY SOLUTIONS MARKET, BY REGION, 2021–2024 (USD MILLION)
TABLE 66
FIRE PROTECTION SERVICES: SECURITY SOLUTIONS MARKET, BY REGION, 2025–2030 (USD MILLION)
TABLE 67
VIDEO SURVEILLANCE SERVICES: SECURITY SOLUTIONS MARKET, BY TYPE, 2021–2024 (USD MILLION)
TABLE 68
VIDEO SURVEILLANCE SERVICES: SECURITY SOLUTIONS MARKET, BY TYPE, 2025–2030 (USD MILLION)
TABLE 69
VIDEO SURVEILLANCE SERVICES: SECURITY SOLUTIONS MARKET, BY REGION, 2021–2024 (USD MILLION)
TABLE 70
VIDEO SURVEILLANCE SERVICES: SECURITY SOLUTIONS MARKET, BY REGION, 2025–2030 (USD MILLION)
TABLE 71
VIDEO SURVEILLANCE AS A SERVICE: SECURITY SOLUTIONS MARKET, BY REGION, 2021–2024 (USD MILLION)
TABLE 72
VIDEO SURVEILLANCE AS A SERVICE: SECURITY SOLUTIONS MARKET, BY REGION, 2025–2030 (USD MILLION)
TABLE 73
INSTALLATION AND MAINTENANCE: SECURITY SOLUTIONS MARKET, BY REGION, 2021–2024 (USD MILLION)
TABLE 74
INSTALLATION AND MAINTENANCE: SECURITY SOLUTIONS MARKET, BY REGION, 2025–2030 (USD MILLION)
TABLE 75
ACCESS CONTROL SERVICES: SECURITY SOLUTIONS MARKET, BY TYPE, 2021–2024 (USD MILLION)
TABLE 76
ACCESS CONTROL SERVICES: SECURITY SOLUTIONS MARKET, BY TYPE, 2025–2030 (USD MILLION)
TABLE 77
ACCESS CONTROL SERVICES: SECURITY SOLUTIONS MARKET, BY REGION, 2021–2024 (USD MILLION)
TABLE 78
ACCESS CONTROL SERVICES: SECURITY SOLUTIONS MARKET, BY REGION, 2025–2030 (USD MILLION)
TABLE 79
SECURITY SYSTEM INTEGRATION SERVICES: SECURITY SOLUTIONS MARKET, BY REGION, 2021–2024 (USD MILLION)
TABLE 80
SECURITY SYSTEM INTEGRATION SERVICES: SECURITY SOLUTIONS MARKET, BY REGION, 2025–2030 (USD MILLION)
TABLE 81
REMOTE MONITORING SERVICES: SECURITY SOLUTIONS MARKET, BY REGION, 2021–2024 (USD MILLION)
TABLE 82
REMOTE MONITORING SERVICES: SECURITY SOLUTIONS MARKET, BY REGION, 2025–2030 (USD MILLION)
TABLE 83
SECURITY SOLUTIONS MARKET, BY VERTICAL, 2021–2024 (USD MILLION)
TABLE 84
SECURITY SOLUTIONS MARKET, BY VERTICAL, 2025–2030 (USD MILLION)
TABLE 85
RESIDENTIAL: SECURITY SOLUTIONS MARKET, BY REGION, 2021–2024 (USD MILLION)
TABLE 86
RESIDENTIAL: SECURITY SOLUTIONS MARKET, BY REGION, 2025–2030 (USD MILLION)
TABLE 87
COMMERCIAL: SECURITY SOLUTIONS MARKET, BY REGION, 2021–2024 (USD MILLION)
TABLE 88
COMMERCIAL: SECURITY SOLUTIONS MARKET, BY REGION, 2025–2030 (USD MILLION)
TABLE 89
GOVERNMENT: SECURITY SOLUTIONS MARKET, BY REGION, 2021–2024 (USD MILLION)
TABLE 90
GOVERNMENT: SECURITY SOLUTIONS MARKET, BY REGION, 2025–2030 (USD MILLION)
TABLE 91
TRANSPORTATION: SECURITY SOLUTIONS MARKET, BY REGION, 2021–2024 (USD MILLION)
TABLE 92
TRANSPORTATION: SECURITY SOLUTIONS MARKET, BY REGION, 2025–2030 (USD MILLION)
TABLE 93
RETAIL: SECURITY SOLUTIONS MARKET, BY REGION, 2021–2024 (USD MILLION)
TABLE 94
RETAIL: SECURITY SOLUTIONS MARKET, BY REGION, 2025–2030 (USD MILLION)
TABLE 95
BANKING AND FINANCE: SECURITY SOLUTIONS MARKET, BY REGION, 2021–2024 (USD MILLION)
TABLE 96
BANKING AND FINANCE: SECURITY SOLUTIONS MARKET, BY REGION, 2025–2030 (USD MILLION)
TABLE 97
EDUCATION: SECURITY SOLUTIONS MARKET, BY REGION, 2021–2024 (USD MILLION)
TABLE 98
EDUCATION: SECURITY SOLUTIONS MARKET, BY REGION, 2025–2030 (USD MILLION)
TABLE 99
INDUSTRIAL: SECURITY SOLUTIONS MARKET, BY REGION, 2021–2024 (USD MILLION)
TABLE 100
INDUSTRIAL: SECURITY SOLUTIONS MARKET, BY REGION, 2025–2030 (USD MILLION)
TABLE 101
ENERGY & UTILITIES: SECURITY SOLUTIONS MARKET, BY REGION, 2021–2024 (USD MILLION)
TABLE 102
ENERGY & UTILITIES: SECURITY SOLUTIONS MARKET, BY REGION, 2025–2030 (USD MILLION)
TABLE 103
SPORTS & LAISURE: SECURITY SOLUTIONS MARKET, BY REGION, 2021–2024 (USD MILLION)
TABLE 104
SPORTS & LAISURE: SECURITY SOLUTIONS MARKET, BY REGION, 2025–2030 (USD MILLION)
TABLE 105
HEALTHCARE: SECURITY SOLUTIONS MARKET, BY REGION, 2021–2024 (USD MILLION)
TABLE 106
HEALTHCARE: SECURITY SOLUTIONS MARKET, BY REGION, 2025–2030 (USD MILLION)
TABLE 107
MILITARY AND DEFENSE: SECURITY SOLUTIONS MARKET, BY REGION, 2021–2024 (USD MILLION)
TABLE 108
MILITARY AND DEFENSE: SECURITY SOLUTIONS MARKET, BY REGION, 2025–2030 (USD MILLION)
TABLE 109
SECURITY SOLUTIONS MARKET, BY REGION, 2021–2024 (USD MILLION)
TABLE 110
SECURITY SOLUTIONS MARKET, BY REGION, 2025–2030 (USD MILLION)
TABLE 111
NORTH AMERICA: SECURITY SOLUTIONS MARKET, BY COUNTRY, 2021–2024 (USD MILLION)
TABLE 112
NORTH AMERICA: SECURITY SOLUTIONS MARKET, BY COUNTRY, 2025–2030 (USD MILLION)
TABLE 113
NORTH AMERICA: SECURITY SOLUTIONS MARKET, BY SYSTEM, 2021–2024 (USD MILLION)
TABLE 114
NORTH AMERICA: SECURITY SOLUTIONS MARKET, BY SYSTEM, 2025–2030 (USD MILLION)
TABLE 115
NORTH AMERICA: SECURITY SOLUTIONS MARKET FOR FIRE PROTECTION SYSTEMS, BY TYPE, 2021–2024 (USD MILLION)
TABLE 116
NORTH AMERICA: SECURITY SOLUTIONS MARKET FOR FIRE PROTECTION SYSTEMS, BY TYPE, 2025–2030 (USD MILLION)
TABLE 117
NORTH AMERICA: SECURITY SOLUTIONS MARKET FOR VIDEO SURVEILLANCE SYSTEMS, BY TYPE, 2021–2024 (USD MILLION)
TABLE 118
NORTH AMERICA: SECURITY SOLUTIONS MARKET FOR VIDEO SURVEILLANCE SYSTEMS, BY TYPE, 2025–2030 (USD MILLION)
TABLE 119
NORTH AMERICA: SECURITY SOLUTIONS MARKET, BY SERVICE, 2021–2024 (USD MILLION)
TABLE 120
NORTH AMERICA: SECURITY SOLUTIONS MARKET, BY SERVICE, 2025–2030 (USD MILLION)
TABLE 121
NORTH AMERICA: SECURITY SOLUTIONS MARKET FOR VIDEO SURVEILLANCE SERVICES, BY TYPE, 2021–2024 (USD MILLION)
TABLE 122
NORTH AMERICA SECURITY SOLUTIONS MARKET FOR VIDEO SURVEILLANCE SERVICES, BY TYPE, 2025–2030 (USD MILLION)
TABLE 123
NORTH AMERICA: SECURITY SOLUTIONS MARKET, BY VERTICAL, 2021–2024 (USD MILLION)
TABLE 124
NORTH AMERICA: SECURITY SOLUTIONS MARKET, BY VERTICAL, 2025–2030 (USD MILLION)
TABLE 125
EUROPE: SECURITY SOLUTIONS MARKET, BY COUNTRY, 2021–2024 (USD MILLION)
TABLE 126
EUROPE: SECURITY SOLUTIONS MARKET, BY COUNTRY, 2025–2030 (USD MILLION)
TABLE 127
EUROPE: SECURITY SOLUTIONS MARKET, BY SYSTEM, 2021–2024 (USD MILLION)
TABLE 128
EUROPE: SECURITY SOLUTIONS MARKET, BY SYSTEM, 2025–2030 (USD MILLION)
TABLE 129
EUROPE: SECURITY SOLUTIONS MARKET FOR FIRE PROTECTION SYSTEMS, BY TYPE, 2021–2024 (USD MILLION)
TABLE 130
EUROPE: SECURITY SOLUTIONS MARKET FOR FIRE PROTECTION SYSTEMS, BY TYPE, 2025–2030 (USD MILLION)
TABLE 131
EUROPE: SECURITY SOLUTIONS MARKET FOR VIDEO SURVEILLANCE SYSTEMS, BY TYPE, 2021–2024 (USD MILLION)
TABLE 132
EUROPE: SECURITY SOLUTIONS MARKET FOR VIDEO SURVEILLANCE SYSTEMS, BY TYPE, 2025–2030 (USD MILLION)
TABLE 133
EUROPE: SECURITY SOLUTIONS MARKET, BY SERVICE, 2021–2024 (USD MILLION)
TABLE 134
EUROPE: SECURITY SOLUTIONS MARKET, BY SERVICE, 2025–2030 (USD MILLION)
TABLE 135
EUROPE: SECURITY SOLUTIONS MARKET FOR VIDEO SURVEILLANCE SERVICES, BY TYPE, 2021–2024 (USD MILLION)
TABLE 136
EUROPE: SECURITY SOLUTIONS MARKET FOR VIDEO SURVEILLANCE SERVICES, BY TYPE, 2025–2030 (USD MILLION)
TABLE 137
EUROPE: SECURITY SOLUTIONS MARKET, BY VERTICAL, 2021–2024 (USD MILLION)
TABLE 138
EUROPE: SECURITY SOLUTIONS MARKET, BY VERTICAL, 2025–2030 (USD MILLION)
TABLE 139
ASIA PACIFIC: SECURITY SOLUTIONS MARKET, BY COUNTRY, 2021–2024 (USD MILLION)
TABLE 140
ASIA PACIFIC: SECURITY SOLUTIONS MARKET, BY COUNTRY, 2025–2030 (USD MILLION)
TABLE 141
ASIA PACIFIC: SECURITY SOLUTIONS MARKET, BY SYSTEM, 2021–2024 (USD MILLION)
TABLE 142
ASIA PACIFIC: SECURITY SOLUTIONS MARKET, BY SYSTEM, 2025–2030 (USD MILLION)
TABLE 143
ASIA PACIFIC: SECURITY SOLUTIONS MARKET FOR FIRE PROTECTION SYSTEMS, BY TYPE, 2021–2024 (USD MILLION)
TABLE 144
ASIA PACIFIC: SECURITY SOLUTIONS MARKET FOR FIRE PROTECTION SYSTEMS, BY TYPE, 2025–2030 (USD MILLION)
TABLE 145
ASIA PACIFIC: SECURITY SOLUTIONS MARKET FOR VIDEO SURVEILLANCE SYSTEMS, BY TYPE, 2021–2024 (USD MILLION)
TABLE 146
ASIA PACIFIC: SECURITY SOLUTIONS MARKET FOR VIDEO SURVEILLANCE SYSTEMS, BY TYPE, 2025–2030 (USD MILLION)
TABLE 147
ASIA PACIFIC: SECURITY SOLUTIONS MARKET, BY SERVICE, 2021–2024 (USD MILLION)
TABLE 148
ASIA PACIFIC: SECURITY SOLUTIONS MARKET, BY SERVICE, 2025–2030 (USD MILLION)
TABLE 149
ASIA PACIFIC: SECURITY SOLUTIONS MARKET FOR VIDEO SURVEILLANCE SERVICES, BY TYPE, 2021–2024 (USD MILLION)
TABLE 150
ASIA PACIFIC: SECURITY SOLUTIONS MARKET FOR VIDEO SURVEILLANCE SERVICES, BY TYPE, 2025–2030 (USD MILLION)
TABLE 151
ASIA PACIFIC: SECURITY SOLUTIONS MARKET, BY VERTICAL, 2021–2024 (USD MILLION)
TABLE 152
ASIA PACIFIC: SECURITY SOLUTIONS MARKET, BY VERTICAL, 2025–2030 (USD MILLION)
TABLE 153
ROW: SECURITY SOLUTIONS MARKET, BY REGION, 2021–2024 (USD MILLION)
TABLE 154
ROW: SECURITY SOLUTIONS MARKET, BY REGION, 2025–2030 (USD MILLION)
TABLE 155
ROW: SECURITY SOLUTIONS MARKET, BY SYSTEM, 2021–2024 (USD MILLION)
TABLE 156
ROW: SECURITY SOLUTIONS MARKET, BY SYSTEM, 2025–2030 (USD MILLION)
TABLE 157
ROW: SECURITY SOLUTIONS MARKET FOR FIRE PROTECTION SYSTEMS, BY TYPE, 2021–2024 (USD MILLION)
TABLE 158
ROW: SECURITY SOLUTIONS MARKET FOR FIRE PROTECTION SYSTEMS, BY TYPE, 2025–2030 (USD MILLION)
TABLE 159
ROW SECURITY SOLUTIONS MARKET FOR VIDEO SURVEILLANCE SYSTEMS, BY TYPE, 2021–2024 (USD MILLION)
TABLE 160
ROW: SECURITY SOLUTIONS MARKET FOR VIDEO SURVEILLANCE SYSTEMS, BY TYPE, 2025–2030 (USD MILLION)
TABLE 161
ROW: SECURITY SOLUTIONS MARKET, BY SERVICE, 2021–2024 (USD MILLION)
TABLE 162
ROW: SECURITY SOLUTIONS MARKET, BY SERVICE, 2025–2030 (USD MILLION)
TABLE 163
ROW: SECURITY SOLUTIONS MARKET FOR VIDEO SURVEILLANCE SERVICES, BY TYPE, 2021–2024 (USD MILLION)
TABLE 164
ROW: SECURITY SOLUTIONS MARKET FOR VIDEO SURVEILLANCE SERVICES, BY TYPE, 2025–2030 (USD MILLION)
TABLE 165
ROW: SECURITY SOLUTIONS MARKET, BY VERTICAL, 2021–2024 (USD MILLION)
TABLE 166
ROW: SECURITY SOLUTIONS MARKET, BY VERTICAL, 2025–2030 (USD MILLION)
TABLE 167
MIDDLE EAST: SECURITY SOLUTIONS MARKET, BY COUNTRY, 2021–2024 (USD MILLION)
TABLE 168
MIDDLE EAST: SECURITY SOLUTIONS MARKET, BY COUNTRY, 2025–2030 (USD MILLION)
TABLE 169
AFRICA: SECURITY SOLUTIONS MARKET, BY COUNTRY, 2021–2024 (USD MILLION)
TABLE 170
AFRICA: SECURITY SOLUTIONS MARKET, BY COUNTRY, 2025–2030 (USD MILLION)
TABLE 171
SECURITY SOLUTIONS MARKET: OVERVIEW OF STRATEGIES ADOPTED BY KEY PLAYERS, 2021–2025
TABLE 172
SECURITY SOLUTIONS MARKET FOR SYSTEMS: DEGREE OF COMPETITION, 2024
TABLE 173
SECURITY SOLUTIONS MARKET FOR SERVICES: DEGREE OF COMPETITION, 2024
TABLE 174
SECURITY SOLUTIONS MARKET: REGION FOOTPRINT
TABLE 175
SECURITY SOLUTIONS MARKET: SYSTEM FOOTPRINT
TABLE 176
SECURITY SOLUTIONS MARKET: SERVICE FOOTPRINT
TABLE 177
SECURITY SOLUTIONS MARKET: VERTICAL FOOTPRINT
TABLE 178
SECURITY SOLUTIONS MARKET: DETAILED LIST OF KEY STARTUPS/SMES
TABLE 179
SECURITY SOLUTIONS MARKET: COMPETITIVE BENCHMARKING OF KEY STARTUPS/SMES
TABLE 180
SECURITY SOLUTIONS MARKET: PRODUCT LAUNCHES, JANUARY 2021− AUGUST 2025
TABLE 181
SECURITY SOLUTIONS MARKET: DEALS JANUARY 2021− AUGUST 2025
TABLE 182
JOHNSON CONTROLS: COMPANY OVERVIEW
TABLE 183
JOHNSON CONTROLS: PRODUCTS/SOLUTIONS/SERVICES OFFERED
TABLE 184
JOHNSON CONTROLS: PRODUCT LAUNCHES
TABLE 185
JOHNSON CONTROLS: DEALS
TABLE 186
HONEYWELL INTERNATIONAL INC.: COMPANY OVERVIEW
TABLE 187
HONEYWELL INTERNATIONAL INC.: PRODUCTS/SOLUTIONS/SERVICES OFFERED
TABLE 188
HONEYWELL INTERNATIONAL INC.: PRODUCT LAUNCHES
TABLE 189
HONEYWELL INTERNATIONAL INC.: DEALS
TABLE 190
ROBERT BOSCH GMBH: COMPANY OVERVIEW
TABLE 191
ROBERT BOSCH GMBH: PRODUCTS/SOLUTIONS/SERVICES OFFERED
TABLE 192
ROBERT BOSCH GMBH: PRODUCT LAUNCHES
TABLE 193
ROBERT BOSCH GMBH: DEALS
TABLE 194
ADT SECURITY SERVICES: COMPANY OVERVIEW
TABLE 195
ADT SECURITY SERVICES: PRODUCTS/SOLUTIONS/SERVICES OFFERED
TABLE 196
ADT SECURITY SERVICES: PRODUCT LAUNCHES
TABLE 197
ADT SECURITY SERVICES: DEALS
TABLE 198
HANGZHOU HIKVISION DIGITAL TECHNOLOGY CO., LTD: COMPANY OVERVIEW
TABLE 199
HANGZHOU HIKVISION DIGITAL TECHNOLOGY CO., LTD: PRODUCTS/SOLUTIONS/SERVICES OFFERED
TABLE 200
HANGZHOU HIKVISION DIGITAL TECHNOLOGY CO., LTD: PRODUCT LAUNCHES
TABLE 201
HANGZHOU HIKVISION DIGITAL TECHNOLOGY CO., LTD.: DEALS
TABLE 202
AXIS COMMUNICATIONS AB: COMPANY OVERVIEW
TABLE 203
AXIS COMMUNICATIONS AB.: PRODUCTS/SOLUTIONS/SERVICES OFFERED
TABLE 204
AXIS COMMUNICATIONS AB: PRODUCT LAUNCHES
TABLE 205
AXIS COMMUNICATIONS AB: DEALS
TABLE 206
DAHUA TECHNOLOGY CO., LTD: COMPANY OVERVIEW
TABLE 207
DAHUA TECHNOLOGY CO., LTD: PRODUCTS/SOLUTIONS/SERVICES OFFERED
TABLE 208
DAHUA TECHNOLOGY CO., LTD: PRODUCT LAUNCHES
TABLE 209
SECOM CO., LTD: COMPANY OVERVIEW
TABLE 210
SECOM CO., LTD: PRODUCTS/SOLUTIONS/SERVICES OFFERED
TABLE 211
SECOM CO., LTD: PRODUCT LAUNCHES
TABLE 212
SIEMENS: COMPANY OVERVIEW
TABLE 213
SIEMENS: PRODUCTS/SOLUTIONS/SERVICES OFFERED
TABLE 214
ASSA ABLOY.: COMPANY OVERVIEW
TABLE 215
ASSA ABLOY: PRODUCTS/SOLUTIONS/SERVICES OFFERED
TABLE 216
ASSA ABLOY: DEALS
TABLE 217
KEENFINITY: COMPANY OVERVIEW
TABLE 218
KEENFINITY: PRODUCTS/SOLUTIONS/SERVICES OFFERED
LIST OF FIGURES
FIGURE 1
SECURITY SOLUTIONS MARKET SEGMENTATION AND REGIONAL SCOPE
FIGURE 2
SECURITY SOLUTIONS MARKET: RESEARCH DESIGN
FIGURE 3
REVENUE GENERATED BY COMPANIES FROM SALES OF SECURITY SYSTEMS
FIGURE 4
REVENUE GENERATED BY COMPANIES FROM SALES OF SECURITY SERVICES
FIGURE 5
SECURITY SOLUTIONS MARKET: BOTTOM-UP APPROACH
FIGURE 6
SECURITY SOLUTIONS MARKET: TOP-DOWN APPROACH
FIGURE 7
SECURITY SOLUTIONS MARKET: DATA TRIANGULATION
FIGURE 8
VIDEO SURVEILLANCE SYSTEMS TO EXHIBIT HIGHEST CAGR DURING FORECAST PERIOD
FIGURE 9
SECURITY SYSTEM INTEGRATION SERVICES SEGMENT TO ACCOUNT FOR LARGEST MARKET SHARE IN 2025
FIGURE 10
COMMERCIAL SEGMENT TO RECORD HIGHEST CAGR DURING FORECAST PERIOD
FIGURE 11
ASIA PACIFIC TO EXHIBIT HIGHEST CAGR DURING FORECAST PERIOD
FIGURE 12
RAPID URBANIZATION AND INVESTMENTS IN SMART INFRASTRUCTURE TO BOOST DEMAND
FIGURE 13
VIDEO SURVEILANCE SYSTEMS SEGMENT TO CAPTURE LARGEST MARKET SHARE IN 2025
FIGURE 14
VIDEO SURVEILLANCE SERVICES SEGMENT TO RECORD HIGHEST CAGR DURING FORECAST PERIOD
FIGURE 15
RESIDENTIAL SEGMENT AND ASIA PACIFIC TO HOLD LARGEST SHARES OF SECURITY SOLUTIONS MARKET IN 2030
FIGURE 16
SOUTH KOREA TO REGISTER HIGHEST CAGR IN GLOBAL SECURITY SOLUTIONS MARKET FROM 2025 TO 2030
FIGURE 17
SECURITY SOLUTIONS MARKET: DRIVERS, RESTRAINTS, OPPORTUNITIES, AND CHALLENGES
FIGURE 18
SECURITY SOLUTIONS MARKET: IMPACT ANALYSIS OF DRIVERS
FIGURE 19
SECURITY SOLUTIONS MARKET: IMPACT ANALYSIS OF RESTRAINTS
FIGURE 20
SECURITY SOLUTIONS MARKET: IMPACT ANALYSIS OF OPPORTUNITIES
FIGURE 21
SECURITY SOLUTIONS MARKET: IMPACT ANALYSIS OF CHALLENGES
FIGURE 22
SECURITY SOLUTIONS MARKET: VALUE CHAIN ANALYSIS
FIGURE 23
SECURITY SOLUTIONS MARKET: ECOSYSTEM ANALYSIS
FIGURE 24
INVESTMENT AND FUNDING SCENARIO, 2024
FIGURE 25
AVERAGE SELLING PRICE TREND OF SECURITY SOLUTIONS, BY SYSTEM, 2020–2024
FIGURE 26
AVERAGE SELLING PRICE TREND OF SECURITY SOLUTIONS, BY REGION, 2020–2024
FIGURE 27
TRENDS/DISRUPTIONS IMPACTING CUSTOMER BUSINESS
FIGURE 28
SECURITY SOLUTIONS MARKET: PORTER'S FIVE FORCES ANALYSIS
FIGURE 29
INFLUENCE OF STAKEHOLDERS ON BUYING PROCESS, BY VERTICAL
FIGURE 30
KEY BUYING CRITERIA FOR VERTICALS
FIGURE 31
IMPORTS DATA FOR HS CODE 854231-COMPLIANT PRODUCTS, BY KEY COUNTRY, 2020–2024 (USD MILLION)
FIGURE 32
EXPORT DATA FOR HS CODE 854231-COMPLIANT PRODUCTS, BY COUNTRY, 2020–2024 (USD MILLION)
FIGURE 33
SECURITY SOLUTIONS MARKET: PATENT ANALYSIS, 2015−2024
FIGURE 34
IMPACT OF AI ON SECURITY SOLUTIONS MARKET
FIGURE 35
VIDEO SURVEILLANCE SYSTEMS SEGMENT TO REGISTER HIGHEST CAGR IN SECURITY SOLUTIONS MARKET DURING FORECAST PERIOD
FIGURE 36
SECURITY SYSTEM INTEGRATION SERVICES SEGMENT TO HOLD LARGEST MARKET SHARE IN 2030
FIGURE 37
COMMERCIAL SEGMENT TO DOMINATE SECURITY SOLUTIONS MARKET IN 2030
FIGURE 38
ASIA PACIFIC TO RECORD HIGHEST CAGR DURING FORECAST PERIOD
FIGURE 39
NORTH AMERICA: SECURITY SOLUTIONS MARKET SNAPSHOT
FIGURE 40
EUROPE: SECURITY SOLUTIONS MARKET SNAPSHOT
FIGURE 41
ASIA PACIFIC: SECURITY SOLUTIONS MARKET SNAPSHOT
FIGURE 42
SECURITY SOLUTIONS MARKET: REVENUE ANALYSIS OF TOP FIVE PLAYERS, 2020–2024
FIGURE 43
MARKET SHARE ANALYSIS OF KEY PLAYERS OFFERING SYSTEMS IN SECURITY SOLUTIONS MARKET, 2024
FIGURE 44
MARKET SHARE ANALYSIS OF KEY PLAYERS OFFERING SERVICES IN SECURITY SOLUTIONS MARKET, 2024
FIGURE 45
COMPANY VALUATION
FIGURE 46
FINANCIAL METRICS (EV/EBITDA)
FIGURE 47
BRAND COMPARISON
FIGURE 48
SECURITY SOLUTIONS MARKET: COMPANY EVALUATION MATRIX (KEY COMPANIES), 2024
FIGURE 49
SECURITY SOLUTIONS MARKET: COMPANY FOOTPRINT
FIGURE 50
SECURITY SOLUTIONS MARKET: COMPANY EVALUATION MATRIX (STARTUPS/SMES), 2024
FIGURE 51
JOHNSON CONTROLS: COMPANY SNAPSHOT
FIGURE 52
HONEYWELL INTERNATIONAL INC.: COMPANY SNAPSHOT
FIGURE 53
ROBERT BOSCH GMBH: COMPANY SNAPSHOT
FIGURE 54
ADT SECURITY SERVICES: COMPANY SNAPSHOT
FIGURE 55
HANGZHOU HIKVISION DIGITAL TECHNOLOGY CO., LTD: COMPANY SNAPSHOT
FIGURE 56
SECOM CO., LTD: COMPANY SNAPSHOT
FIGURE 57
SIEMENS: COMPANY SNAPSHOT
FIGURE 58
ASSA ABLOY: COMPANY SNAPSHOT
Methodology
The study used four major activities to estimate the security solutions market size. Exhaustive secondary research was conducted to gather information on the market and its peer and parent markets. The next step was to validate these findings, assumptions, and market size with industry experts across the value chain through primary research. Both top-down and bottom-up approaches were employed to estimate the total market size. Finally, market breakdown and data triangulation methods were used to estimate the market size for different segments and subsegments.
Secondary Research
In the secondary research process, various sources were used to identify and collect information on the security solutions market. Secondary sources for this research study include corporate filings (such as annual reports, investor presentations, and financial statements); trade, business, and professional associations; white papers; certified publications; and articles by recognized authors, directories, and databases. The secondary data was collected and analyzed to determine the overall market size, and was further validated through primary research.
List of key secondary sources
|
Source |
Web Link |
|
Federal Communications Commission (FCC) |
https://www.fcc.gov/ |
|
National Institute of Standards and Technology (NIST) |
https://www.nist.gov/ |
|
Ministry of Electronics and Information Technology (MeitY) |
https://www.meity.gov.in/ |
|
Ministry of Industry and Information Technology (MIIT) |
https://english.miit.gov.cn/ |
|
Ministry of Internal Affairs and Communications (MIC) |
https://www.soumu.go.jp/english/ |
Primary Research
Primary interviews were conducted to gather insights on market statistics, revenue data, market breakdowns, size estimations, and forecasting. Additionally, primary research was used to comprehend various technologies, types, application, and regional trends. Interviews with stakeholders from the demand side, including CIOs, CTOs, CSOs, and customer/end user installation teams using security solutions offerings and processes, were also conducted to understand their perspective on suppliers, products, component providers, and their current and future use of security solutions, which will impact the overall market. Several primary interviews were conducted across major countries in North America, Europe, Asia Pacific, and RoW.

To know about the assumptions considered for the study, download the pdf brochure
Market Size Estimation
In the complete market engineering process, top-down and bottom-up approaches and several data triangulation methods have been used to estimate and forecast the overall market segments and subsegments listed in this report. Key players in the market have been identified through secondary research, and their market shares in the respective regions have been determined through primary and secondary research. This entire procedure includes the study of annual and financial reports of the top market players and extensive interviews for key insights (quantitative and qualitative) with industry experts (CEOs, VPs, directors, and marketing executives).
All percentage shares, splits, and breakdowns have been determined using secondary sources and verified through primary sources. All the parameters affecting the markets covered in this research study have been accounted for, viewed in detail, verified through primary research, and analyzed to obtain the final quantitative and qualitative data. This data has been consolidated and supplemented with detailed inputs and analysis from MarketsandMarkets and presented in this report. The following figure represents this study's overall market size estimation process.
Security Solutions Market: Top-Down and Bottom-Up Approach

Data Triangulation
Once the overall size of the security solutions market has been determined using the methods described above, it has been divided into multiple segments and subsegments. Market engineering has been performed for each segment and subsegment using market breakdown and data triangulation methods, as applicable, to obtain accurate statistics. Various factors and trends from the demand and supply sides have been studied to triangulate the data. The market size has been validated using both top-down and bottom-up approaches.
Market Definition
Security solutions encompass a comprehensive set of measures, technologies, and practices designed to protect physical assets, facilities, and individuals from unauthorized access, theft, vandalism, and other potential threats. These solutions often include a combination of hardware and software offerings such as access control systems, surveillance cameras, perimeter barriers (e.g., fences, gates), alarm systems, biometric identification systems, and visitor management systems. The primary goal is to create a secure environment that deters intrusions, monitors activities, and responds promptly to security incidents. By deploying tailored physical security solutions, organizations can safeguard their premises, assets, and personnel, thereby mitigating risks, ensuring safety compliance, and maintaining operational continuity.
Key Stakeholders
- Security system providers
- End-user organizations
- System integrators
- Consultants and advisory firms
- Regulatory bodies and compliance agencies
- Technology vendors
- Security service providers
- Distributors and resellers
- Industry associations and organizations
- Investors and financial institutions
Report Objectives
- To describe and forecast the security solutions market, by system, service, vertical, and region, in terms of value
- To describe and forecast the market for various segments across four main regions, namely, North America, Europe, Asia Pacific, and RoW, in terms of value
- To strategically analyze micromarkets with regard to individual growth trends, prospects, and contributions to the markets
- To provide detailed information regarding drivers, restraints, opportunities, and challenges influencing market growth
- To analyze opportunities for stakeholders by identifying high-growth segments in the market
- To offer a detailed overview of the security solutions value chain
- To strategically analyze key technologies, average selling price trends, trends impacting customer business, ecosystem, regulatory landscape, patent landscape, Porter's five forces, import and export scenarios, trade landscape, key stakeholders, buying criteria, and case studies pertaining to the market under study
- To strategically profile key players in the security solutions market and comprehensively analyze their market share and core competencies
- To analyze competitive developments such as partnerships, acquisitions, expansions, collaborations, and product launches, along with R&D in the security solutions market
- To analyze the impact of US Trump tariff and impact of AI on security solutions market.
Available Customizations:
With the given market data, MarketsandMarkets offers customizations according to the specific requirements of companies. The following customization options are available for the report:
- Detailed analysis and profiling of additional market players (up to 5)
- Additional country-level analysis of the security solutions market
Product Analysis
- The product matrix provides a detailed comparison of the product portfolio of each company in the security solutions market.
Key Questions Addressed by the Report
What is the current size of the Security Solutions Market?
The global security solutions market size was valued at USD 370.15 billion in 2025 and is projected to reach USD 523.98 billion by 2030, growing at a CAGR of 7.2%. from 2025 to 2030.
What is the projected market size of the Security Solutions Market by 2030?
The market is projected to reach approximately USD 523.98 billion by 2030, reflecting strong demand for connected security systems.
What CAGR is expected for the Security Solutions Market during the forecast period?
The market is expected to grow at a CAGR of 7.2% from 2025 to 2030.
What are the key trends shaping the Security Solutions Market?
Major trends include AI-powered surveillance, smart cameras, biometric access control, cloud-based monitoring, IoT-enabled security devices, and mobile-controlled security systems.
What is the primary growth driver of the Security Solutions Market?
A key growth driver is the rapid adoption of AI-powered surveillance and biometric access control, enabling smarter threat detection, automated monitoring, and enhanced home security.
Which companies are leading the Security Solutions Market?
Key market participants include ADT Inc., Johnson Controls, Honeywell International, ASSA ABLOY, Allegion, Bosch Security Systems, Hangzhou Hikvision, and SECOM Co., Ltd.
Which industry segment holds a significant share of the Home Security Solutions Market?
The smart home security segment holds a significant share due to increasing adoption of connected cameras, smart locks, alarm systems, and remote monitoring solutions.
Which region dominates the Security Solutions Market?
North America holds a major market share due to high adoption of smart home technologies, while Asia Pacific is expected to witness the fastest growth.
What opportunities are highlighted in the Security Solutions Market report?
Major opportunities include smart city development, AI-enabled video analytics, cloud-based security platforms, wireless security systems, and integration with home automation ecosystems.
What does the report analysis indicate about the future of the Security Solutions Market?
The report indicates strong growth driven by increasing security concerns, smart home adoption, IoT connectivity, AI-powered monitoring, and investments in advanced residential security technologies.
Need a Tailored Report?
Customize this report to your needs
Get 10% FREE Customization
Customize This Report
Fact checked
Personalize This Research
- Triangulate with your Own Data
- Get Data as per your Format and Definition
- Gain a Deeper Dive on a Specific Application, Geography, Customer or Competitor
- Any level of Personalization
Let Us Help You
- What are the Known and Unknown Adjacencies Impacting the Security Solutions Market
- What will your New Revenue Sources be?
- Who will be your Top Customer; what will make them switch?
- Defend your Market Share or Win Competitors
- Get a Scorecard for Target Partners

Custom Market Research Services
We Will Customise The Research For You, In Case The Report Listed Above Does Not Meet With Your Requirements
Get 10% Free CustomisationTESTIMONIALS

Tetsuya Ohhira
Business Development Manager-Technology Business
Nikon Corporation,
Leading Japanese MNC specializing in optics and imaging productswww.nikon.com
MarketsandMarkets™ response
is quick. Their attitude is flexible and positive. Analyst Insights are globally considered and
significant. Client Services quickly respond to our inquiry and demand. Their wide range of global
surveys help us make our strategic plan.
We hope Knowledge Store will be easier to search
for a report.
VP - Marketing & Business Development
Leading Provider of Process Control Solutions
We engaged with MarketsandMarkets on a study to perform an analysis and recommend a Go-To-Market strategy for metrology and process control in the semiconductor market. The study was tailored to our targets and needs with well-defined milestones. Our overall experience with the MarketsandMarkets team was very good throughout the project in all aspects including the analysis methodologies used, the quality and depth of primary and secondary data sets, the professionalism and flexibility of the team and the ability to meet the target schedule and milestones. We want to thank MarketsandMarkets team for a job well done.
- US Security Solutions Market
- Canada Security Solutions Market
- Mexico Security Solutions Market
- UK Security Solutions Market
- Germany Security Solutions Market
- France Security Solutions Market
- Spain Security Solutions Market
- Italy Security Solutions Market
- Nordics Security Solutions Market
- Rest Of Europe Security Solutions Market
- China Security Solutions Market
- Japan Security Solutions Market
- India Security Solutions Market
- South Korea Security Solutions Market
- Australia Security Solutions Market
- Indonesia Security Solutions Market
- Vietnam Security Solutions Market
- Thailand Security Solutions Market
- Malaysia Security Solutions Market
- Rest Of Asia Pacific Security Solutions Market
- Saudi Arabia Security Solutions Market
- UAE Security Solutions Market
- Qatar Security Solutions Market
- Kuwait Security Solutions Market
- Bahrain Security Solutions Market
- Oman Security Solutions Market
- Rest Of Middle East Security Solutions Market
- South Africa Security Solutions Market
- Rest Of Africa Security Solutions Market
Growth opportunities and latent adjacency in Security Solutions Market


Curtis
Apr, 2026
What are the major technology trends, including AI, machine learning, edge computing, and behavioral analytics, shaping next-generation security solutions and surveillance systems?.
User
Apr, 2026
How is rapid urbanization and the expansion of smart cities driving the adoption of advanced security solutions in emerging economies like India and China?.
Justin
Apr, 2026
What are the key buying criteria, stakeholder roles, and decision-making factors influencing the adoption of integrated security systems across industries such as retail, transportation, and healthcare?.